Overview
Selected American Shares PM Commentary
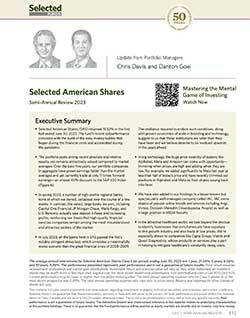
- The end of the "easy-money" decade and its market distortions
- Why business fundamentals matter again
- Why this makes us optimistic about the coming decade
Investment Strategy
The goal of Selected American Shares is to provide investors access to attractive investment opportunities among large cap, durable, well-managed businesses, primarily in the U.S.
Using our signature Davis Investment Discipline, we seek to purchase these businesses at value prices and hold them for the long term. This approach makes Selected American Shares an ideal foundation for an investor's portfolio.
"By being highly selective and rejecting the vast majority of companies in the index, we’ve uncovered businesses with highly attractive earnings growth, yet selling at some of the lowest valuations we have ever seen. We believe this sets the stage for attractive returns in the years ahead.”
– Portfolio Manager Chris Davis
| Selective | Attractive Growth | Undervalued |
|---|---|---|
|
Selected American Shares invests in only a select group of well-researched companies |
Selected American Shares's portfolio companies have offered attractive growth The Attractive Growth and Undervalued reference in this piece relates to underlying characteristics of the portfolio holdings. There is no guarantee that the Fund’s performance will be positive as equity markets are volatile and an investor may lose money. |
Selected American Shares's portfolio companies are 35% less expensive than the index |
| Holdings The number of holdings in the Fund excluding cash positions. | EPS Growth (5 Year) Five-year EPS Growth Rate (5-year EPS) is the average annualized earnings per share growth for a company over the past 5 years. The values shown are the weighted average of the 5-year EPS of the stocks in the Fund or Index. Approximately 2.82% of the assets of the Fund are not accounted for in the calculation of 5-year EPS as relevant information on certain companies is not available to the Fund’s data provider. | P/E (Forward) Forward Price/Earnings (Forward P/E) Ratio is a stock’s price at the date indicated divided by the company’s forecasted earnings for the following 12 months based on estimates provided by the Fund’s data provider. These values for both the Fund and the Index are the weighted average of the stocks in the portfolio or index. |
|
504
39
|
||
|
Fund
S&P 500 Index
|
||
Fund Details as of 3/31/24
| Detail | Value |
|---|---|
| Long-Term Capital Appreciation | |
| Total Net Assets ($M) | 1,856.3 |
| Benchmark | S&P 500 Index |
| Lipper Category | Large Cap Value |
S Shares
| Detail | Value |
|---|---|
| Ticker (S) | SLASX |
| Inception Date (S) | 5/1/93 This is the date Davis Selected Advisers, L.P. took over management of this fund. |
| CUSIP (S) | 816221105 |
| Fund Number (S) | 205 |
| Net Expense Ratio (S) | 0.99% |
| Gross Expense Ratio (S) | 0.99% |
D Shares
| Detail | Value |
|---|---|
| Ticker (D) | SLADX |
| Inception Date (D) | 5/3/04 This is the date Davis Selected Advisers, L.P. took over management of this fund. |
| CUSIP (D) | 816221204 |
| Fund Number (D) | 1023 |
| Net Expense Ratio (D) | 0.67% |
| Gross Expense Ratio (D) | 0.67% |
Performance as of 3/31/24
Growth of $10,000 (Class S Shares since Inception)
Average Annual Returns
S Shares: Quarterly (as of 3/31/24)
|
|
|||||||||||||||||||||||||||||||||||||||||||||||||||||||||||||||||||||||||||||||||||||||||||||||||||||||||||||||||||||||||||||||||||||||||||||||||||||||||||||||||||||||||||||||||||||||||||||||||||||||||||||||||||||||||||||||||||||||||||||||||||||||||||||||||||||||||||||||||||||||||||||||||||||||||||||||||||||||||||||||||||||||||||||||||||||||||||||||||||||||||||||||||||||||||||||||||||||||||||||||||||||||||||||||||||||||||||||||||||||||||||||||||||||||||||||||||||||||||||||||||||||||||||||||||||||||||||||||||||||||||||||||||||||||||||||||||||||||||||||||||||||||||||||||||||||||||||||||||||||||||||||||||||||||||||||||||||||||||||||||||||||||||||||||||||||||||||||||||||||||||||||||||||||||||||||||||||||||||||||||||||||||||||||||||||||||||||||||||||||||||||||||||||||||||||||||||||||||||||||||||||||||||||||||||||||||||||||||||||||||||||||||||||||||||||||||||||||||||||||||||||||||||||||||||||||||||||||||||||||||||||||||||||||||||||||||||||||||||||||||||||||||||||||||||||||||||||||||||||||||
|---|---|---|---|---|---|---|---|---|---|---|---|---|---|---|---|---|---|---|---|---|---|---|---|---|---|---|---|---|---|---|---|---|---|---|---|---|---|---|---|---|---|---|---|---|---|---|---|---|---|---|---|---|---|---|---|---|---|---|---|---|---|---|---|---|---|---|---|---|---|---|---|---|---|---|---|---|---|---|---|---|---|---|---|---|---|---|---|---|---|---|---|---|---|---|---|---|---|---|---|---|---|---|---|---|---|---|---|---|---|---|---|---|---|---|---|---|---|---|---|---|---|---|---|---|---|---|---|---|---|---|---|---|---|---|---|---|---|---|---|---|---|---|---|---|---|---|---|---|---|---|---|---|---|---|---|---|---|---|---|---|---|---|---|---|---|---|---|---|---|---|---|---|---|---|---|---|---|---|---|---|---|---|---|---|---|---|---|---|---|---|---|---|---|---|---|---|---|---|---|---|---|---|---|---|---|---|---|---|---|---|---|---|---|---|---|---|---|---|---|---|---|---|---|---|---|---|---|---|---|---|---|---|---|---|---|---|---|---|---|---|---|---|---|---|---|---|---|---|---|---|---|---|---|---|---|---|---|---|---|---|---|---|---|---|---|---|---|---|---|---|---|---|---|---|---|---|---|---|---|---|---|---|---|---|---|---|---|---|---|---|---|---|---|---|---|---|---|---|---|---|---|---|---|---|---|---|---|---|---|---|---|---|---|---|---|---|---|---|---|---|---|---|---|---|---|---|---|---|---|---|---|---|---|---|---|---|---|---|---|---|---|---|---|---|---|---|---|---|---|---|---|---|---|---|---|---|---|---|---|---|---|---|---|---|---|---|---|---|---|---|---|---|---|---|---|---|---|---|---|---|---|---|---|---|---|---|---|---|---|---|---|---|---|---|---|---|---|---|---|---|---|---|---|---|---|---|---|---|---|---|---|---|---|---|---|---|---|---|---|---|---|---|---|---|---|---|---|---|---|---|---|---|---|---|---|---|---|---|---|---|---|---|---|---|---|---|---|---|---|---|---|---|---|---|---|---|---|---|---|---|---|---|---|---|---|---|---|---|---|---|---|---|---|---|---|---|---|---|---|---|---|---|---|---|---|---|---|---|---|---|---|---|---|---|---|---|---|---|---|---|---|---|---|---|---|---|---|---|---|---|---|---|---|---|---|---|---|---|---|---|---|---|---|---|---|---|---|---|---|---|---|---|---|---|---|---|---|---|---|---|---|---|---|---|---|---|---|---|---|---|---|---|---|---|---|---|---|---|---|---|---|---|---|---|---|---|---|---|---|---|---|---|---|---|---|---|---|---|---|---|---|---|---|---|---|---|---|---|---|---|---|---|---|---|---|---|---|---|---|---|---|---|---|---|---|---|---|---|---|---|---|---|---|---|---|---|---|---|---|---|---|---|---|---|---|---|---|---|---|---|---|---|---|---|---|---|---|---|---|---|---|---|---|---|---|---|---|---|---|---|---|---|---|---|---|---|---|---|---|---|---|---|---|---|---|---|---|---|---|---|---|---|---|---|---|---|---|---|---|---|---|---|---|---|---|---|---|---|---|---|---|---|---|---|---|---|---|---|---|---|---|---|---|---|---|---|---|---|---|---|---|---|---|---|---|---|---|---|---|---|---|---|---|---|---|---|---|---|---|---|---|---|---|---|---|---|---|---|---|---|---|---|---|---|---|---|---|---|---|---|---|---|---|---|---|---|---|---|---|---|---|---|---|---|---|---|---|---|---|---|---|---|---|---|---|---|---|---|---|---|---|---|---|---|---|---|---|---|---|---|---|---|---|---|---|---|---|---|---|---|---|---|---|---|---|---|---|---|---|---|---|---|---|---|---|---|---|---|---|---|---|---|---|---|---|---|---|---|---|---|---|---|---|---|---|---|---|---|---|---|---|---|---|---|---|---|---|---|---|---|---|---|---|---|---|---|---|---|---|---|---|---|---|---|---|---|---|---|---|---|---|---|---|---|---|---|---|---|---|---|---|---|---|---|---|---|---|---|---|---|---|---|---|---|---|---|---|---|---|---|---|---|---|---|---|---|---|---|---|---|---|---|---|---|---|---|---|---|---|---|---|---|---|---|---|---|---|---|---|---|---|---|---|---|---|---|---|---|---|---|---|---|---|---|---|---|---|---|---|---|---|---|---|---|---|---|---|---|---|---|---|---|---|---|---|---|---|---|---|---|---|---|---|---|---|---|---|---|---|---|---|---|---|---|---|---|---|---|---|---|---|---|---|---|---|---|---|---|---|
| Share Class | YTD* | 1 Yr | 3 Yr | 5 Yr | 10 Yr | Since Incep | |||||||||||||||||||||||||||||||||||||||||||||||||||||||||||||||||||||||||||||||||||||||||||||||||||||||||||||||||||||||||||||||||||||||||||||||||||||||||||||||||||||||||||||||||||||||||||||||||||||||||||||||||||||||||||||||||||||||||||||||||||||||||||||||||||||||||||||||||||||||||||||||||||||||||||||||||||||||||||||||||||||||||||||||||||||||||||||||||||||||||||||||||||||||||||||||||||||||||||||||||||||||||||||||||||||||||||||||||||||||||||||||||||||||||||||||||||||||||||||||||||||||||||||||||||||||||||||||||||||||||||||||||||||||||||||||||||||||||||||||||||||||||||||||||||||||||||||||||||||||||||||||||||||||||||||||||||||||||||||||||||||||||||||||||||||||||||||||||||||||||||||||||||||||||||||||||||||||||||||||||||||||||||||||||||||||||||||||||||||||||||||||||||||||||||||||||||||||||||||||||||||||||||||||||||||||||||||||||||||||||||||||||||||||||||||||||||||||||||||||||||||||||||||||||||||||||||||||||||||||||||||||||||||||||||||||||||||||||||||||||||||||||||||||||||||||||||||||||
|
|
S Shares | 13.06% | 40.96% | 7.04% | 12.62% | 10.04% | 10.06% | ||||||||||||||||||||||||||||||||||||||||||||||||||||||||||||||||||||||||||||||||||||||||||||||||||||||||||||||||||||||||||||||||||||||||||||||||||||||||||||||||||||||||||||||||||||||||||||||||||||||||||||||||||||||||||||||||||||||||||||||||||||||||||||||||||||||||||||||||||||||||||||||||||||||||||||||||||||||||||||||||||||||||||||||||||||||||||||||||||||||||||||||||||||||||||||||||||||||||||||||||||||||||||||||||||||||||||||||||||||||||||||||||||||||||||||||||||||||||||||||||||||||||||||||||||||||||||||||||||||||||||||||||||||||||||||||||||||||||||||||||||||||||||||||||||||||||||||||||||||||||||||||||||||||||||||||||||||||||||||||||||||||||||||||||||||||||||||||||||||||||||||||||||||||||||||||||||||||||||||||||||||||||||||||||||||||||||||||||||||||||||||||||||||||||||||||||||||||||||||||||||||||||||||||||||||||||||||||||||||||||||||||||||||||||||||||||||||||||||||||||||||||||||||||||||||||||||||||||||||||||||||||||||||||||||||||||||||||||||||||||||||||||||||||||||||||||||||||||
The average annual total returns for Selected American Shares’s Class S shares for periods ending March 31, 2024 are: 1 year, 40.96%; 5 years, 12.62%; and 10 years, 10.04%. The performance presented represents past performance and is not a guarantee of future results. Total return assumes reinvestment of dividends and capital gain distributions. Investment return and principal value will vary so that, when redeemed, an investor’s shares may be worth more or less than their original cost. For most recent month-end performance, visit selectedfunds.com or call 800-243-1575. Current performance may be lower or higher than the performance quoted. The total annual operating expense ratio for Class S Shares as of the most recent prospectus was 0.99%. The total annual operating expense ratio may vary in future years. The total annual operating expense ratio may vary in future years. Returns and expenses for other classes of shares will vary.
S Shares: Monthly (as of 3/31/24)
|
|
|||||||||||||||||||||||||||||||||||||||||||||||||||||||||||||||||||||||||||||||||||||||||||||||||||||||||||||||||||||||||||||||||||||||||||||||||||||||||||||||||||||||||||||||||||||||||||||||||||||||||||||||||||||||||||||||||||||||||||||||||||||||||||||||||||||||||||||||||||||||||||||||||||||||||||||||||||||||||||||||||||||||||||||||||||||||||||||||||||||||||||||||||||||||||||||||||||||||||||||||||||||||||||||||||||||||||||||||||||||||||||||||||||||||||||||||||||||||||||||||||||||||||||||||||||||||||||||||||||||||||||||||||||||||||||||||||||||||||||||||||||||||||||||||||||||||||||||||||||||||||||||||||||||||||||||||||||||||||||||||||||||||||||||||||||||||||||||||||||||||||||||||||||||||||||||||||||||||||||||||||||||||||||||||||||||||||||||||||||||||||||||||||||||||||||||||||||||||||||||||||||||||||||||||||||||||||||||||||||||||||||||||||||||||||||||||||||||||||||||||||||||||||||||||||||||||||||||||||||||||||||||||||||||||||||||||||||||||||||||||||||||||||||||||||||||||||||||||||||||||
|---|---|---|---|---|---|---|---|---|---|---|---|---|---|---|---|---|---|---|---|---|---|---|---|---|---|---|---|---|---|---|---|---|---|---|---|---|---|---|---|---|---|---|---|---|---|---|---|---|---|---|---|---|---|---|---|---|---|---|---|---|---|---|---|---|---|---|---|---|---|---|---|---|---|---|---|---|---|---|---|---|---|---|---|---|---|---|---|---|---|---|---|---|---|---|---|---|---|---|---|---|---|---|---|---|---|---|---|---|---|---|---|---|---|---|---|---|---|---|---|---|---|---|---|---|---|---|---|---|---|---|---|---|---|---|---|---|---|---|---|---|---|---|---|---|---|---|---|---|---|---|---|---|---|---|---|---|---|---|---|---|---|---|---|---|---|---|---|---|---|---|---|---|---|---|---|---|---|---|---|---|---|---|---|---|---|---|---|---|---|---|---|---|---|---|---|---|---|---|---|---|---|---|---|---|---|---|---|---|---|---|---|---|---|---|---|---|---|---|---|---|---|---|---|---|---|---|---|---|---|---|---|---|---|---|---|---|---|---|---|---|---|---|---|---|---|---|---|---|---|---|---|---|---|---|---|---|---|---|---|---|---|---|---|---|---|---|---|---|---|---|---|---|---|---|---|---|---|---|---|---|---|---|---|---|---|---|---|---|---|---|---|---|---|---|---|---|---|---|---|---|---|---|---|---|---|---|---|---|---|---|---|---|---|---|---|---|---|---|---|---|---|---|---|---|---|---|---|---|---|---|---|---|---|---|---|---|---|---|---|---|---|---|---|---|---|---|---|---|---|---|---|---|---|---|---|---|---|---|---|---|---|---|---|---|---|---|---|---|---|---|---|---|---|---|---|---|---|---|---|---|---|---|---|---|---|---|---|---|---|---|---|---|---|---|---|---|---|---|---|---|---|---|---|---|---|---|---|---|---|---|---|---|---|---|---|---|---|---|---|---|---|---|---|---|---|---|---|---|---|---|---|---|---|---|---|---|---|---|---|---|---|---|---|---|---|---|---|---|---|---|---|---|---|---|---|---|---|---|---|---|---|---|---|---|---|---|---|---|---|---|---|---|---|---|---|---|---|---|---|---|---|---|---|---|---|---|---|---|---|---|---|---|---|---|---|---|---|---|---|---|---|---|---|---|---|---|---|---|---|---|---|---|---|---|---|---|---|---|---|---|---|---|---|---|---|---|---|---|---|---|---|---|---|---|---|---|---|---|---|---|---|---|---|---|---|---|---|---|---|---|---|---|---|---|---|---|---|---|---|---|---|---|---|---|---|---|---|---|---|---|---|---|---|---|---|---|---|---|---|---|---|---|---|---|---|---|---|---|---|---|---|---|---|---|---|---|---|---|---|---|---|---|---|---|---|---|---|---|---|---|---|---|---|---|---|---|---|---|---|---|---|---|---|---|---|---|---|---|---|---|---|---|---|---|---|---|---|---|---|---|---|---|---|---|---|---|---|---|---|---|---|---|---|---|---|---|---|---|---|---|---|---|---|---|---|---|---|---|---|---|---|---|---|---|---|---|---|---|---|---|---|---|---|---|---|---|---|---|---|---|---|---|---|---|---|---|---|---|---|---|---|---|---|---|---|---|---|---|---|---|---|---|---|---|---|---|---|---|---|---|---|---|---|---|---|---|---|---|---|---|---|---|---|---|---|---|---|---|---|---|---|---|---|---|---|---|---|---|---|---|---|---|---|---|---|---|---|---|---|---|---|---|---|---|---|---|---|---|---|---|---|---|---|---|---|---|---|---|---|---|---|---|---|---|---|---|---|---|---|---|---|---|---|---|---|---|---|---|---|---|---|---|---|---|---|---|---|---|---|---|---|---|---|---|---|---|---|---|---|---|---|---|---|---|---|---|---|---|---|---|---|---|---|---|---|---|---|---|---|---|---|---|---|---|---|---|---|---|---|---|---|---|---|---|---|---|---|---|---|---|---|---|---|---|---|---|---|---|---|---|---|---|---|---|---|---|---|---|---|---|---|---|---|---|---|---|---|---|---|---|---|---|---|---|---|---|---|---|---|---|---|---|---|---|---|---|---|---|---|---|---|---|---|---|---|---|---|---|---|---|---|---|---|---|---|---|---|---|---|---|---|---|---|---|---|---|---|---|---|---|---|---|---|---|---|---|---|---|---|---|---|---|---|---|---|---|---|---|---|---|---|---|---|---|---|---|---|---|---|---|---|---|---|---|---|---|---|---|---|---|---|---|---|---|---|---|---|---|---|---|---|---|---|---|---|---|---|---|---|
| Share Class | YTD* | 1 Yr | 3 Yr | 5 Yr | 10 Yr | Since Incep | |||||||||||||||||||||||||||||||||||||||||||||||||||||||||||||||||||||||||||||||||||||||||||||||||||||||||||||||||||||||||||||||||||||||||||||||||||||||||||||||||||||||||||||||||||||||||||||||||||||||||||||||||||||||||||||||||||||||||||||||||||||||||||||||||||||||||||||||||||||||||||||||||||||||||||||||||||||||||||||||||||||||||||||||||||||||||||||||||||||||||||||||||||||||||||||||||||||||||||||||||||||||||||||||||||||||||||||||||||||||||||||||||||||||||||||||||||||||||||||||||||||||||||||||||||||||||||||||||||||||||||||||||||||||||||||||||||||||||||||||||||||||||||||||||||||||||||||||||||||||||||||||||||||||||||||||||||||||||||||||||||||||||||||||||||||||||||||||||||||||||||||||||||||||||||||||||||||||||||||||||||||||||||||||||||||||||||||||||||||||||||||||||||||||||||||||||||||||||||||||||||||||||||||||||||||||||||||||||||||||||||||||||||||||||||||||||||||||||||||||||||||||||||||||||||||||||||||||||||||||||||||||||||||||||||||||||||||||||||||||||||||||||||||||||||||||||||||||||
|
|
S Shares | 13.06% | 40.96% | 7.04% | 12.62% | 10.04% | 10.06% | ||||||||||||||||||||||||||||||||||||||||||||||||||||||||||||||||||||||||||||||||||||||||||||||||||||||||||||||||||||||||||||||||||||||||||||||||||||||||||||||||||||||||||||||||||||||||||||||||||||||||||||||||||||||||||||||||||||||||||||||||||||||||||||||||||||||||||||||||||||||||||||||||||||||||||||||||||||||||||||||||||||||||||||||||||||||||||||||||||||||||||||||||||||||||||||||||||||||||||||||||||||||||||||||||||||||||||||||||||||||||||||||||||||||||||||||||||||||||||||||||||||||||||||||||||||||||||||||||||||||||||||||||||||||||||||||||||||||||||||||||||||||||||||||||||||||||||||||||||||||||||||||||||||||||||||||||||||||||||||||||||||||||||||||||||||||||||||||||||||||||||||||||||||||||||||||||||||||||||||||||||||||||||||||||||||||||||||||||||||||||||||||||||||||||||||||||||||||||||||||||||||||||||||||||||||||||||||||||||||||||||||||||||||||||||||||||||||||||||||||||||||||||||||||||||||||||||||||||||||||||||||||||||||||||||||||||||||||||||||||||||||||||||||||||||||||||||||||||
The average annual total returns for Selected American Shares’s Class S shares for periods ending March 31, 2024 are: 1 year, 40.96%; 5 years, 12.62%; and 10 years, 10.04%. The performance presented represents past performance and is not a guarantee of future results. Total return assumes reinvestment of dividends and capital gain distributions. Investment return and principal value will vary so that, when redeemed, an investor’s shares may be worth more or less than their original cost. For most recent month-end performance, visit selectedfunds.com or call 800-243-1575. Current performance may be lower or higher than the performance quoted. The total annual operating expense ratio for Class S Shares as of the most recent prospectus was 0.99%. The total annual operating expense ratio may vary in future years. The total annual operating expense ratio may vary in future years. Returns and expenses for other classes of shares will vary.
D Shares: Quarterly (as of 3/31/24)
|
|
|||||||||||||||||||||||||||||||||||||||||||||||||||||||||||||||||||||||||||||||||||||||||||||||||||||||||||||||||||||||||||||||||||||||||||||||||||||||||||||||||||||||||||||||||||||||||||||||||||||||||||||||||||||||||||||||||||||||||||||||||||||||||||||||||||||||||||||||||||||||||||||||||||||||||||||||||||||||||||||||||||||||||||||||||||||||||||||||||||||||||||||||||||||||||||||||||||||||||||||||||||||||||||||||||||||||||||||||||||||||||||||||||||||||||||||||||||||||||||||||||||||||||||||||||||||||||||||||||||||||||||||||||||||||||||||||||||||||||||||||||||||||||||||||||||||||||||||||||||||||||||||||||||||||||||||||||||||||||||||||||||||||||||||||||||||||||||||||||||||||||||||||||||||||||||||||||||||||||||||||||||||||||||||||||||||||||||||||||||||||||||||||||||||||||||||||||||||||||||||||||||||||||||||||||||||||||||||||||||||||||||||||||||||||||||||||||||||||||||||||||||||||||||||||||||||||||||||||||||||||||||||||||||||||||||||||||||||||||||||||||||||||||||||||||||||||||||||||||||||||
|---|---|---|---|---|---|---|---|---|---|---|---|---|---|---|---|---|---|---|---|---|---|---|---|---|---|---|---|---|---|---|---|---|---|---|---|---|---|---|---|---|---|---|---|---|---|---|---|---|---|---|---|---|---|---|---|---|---|---|---|---|---|---|---|---|---|---|---|---|---|---|---|---|---|---|---|---|---|---|---|---|---|---|---|---|---|---|---|---|---|---|---|---|---|---|---|---|---|---|---|---|---|---|---|---|---|---|---|---|---|---|---|---|---|---|---|---|---|---|---|---|---|---|---|---|---|---|---|---|---|---|---|---|---|---|---|---|---|---|---|---|---|---|---|---|---|---|---|---|---|---|---|---|---|---|---|---|---|---|---|---|---|---|---|---|---|---|---|---|---|---|---|---|---|---|---|---|---|---|---|---|---|---|---|---|---|---|---|---|---|---|---|---|---|---|---|---|---|---|---|---|---|---|---|---|---|---|---|---|---|---|---|---|---|---|---|---|---|---|---|---|---|---|---|---|---|---|---|---|---|---|---|---|---|---|---|---|---|---|---|---|---|---|---|---|---|---|---|---|---|---|---|---|---|---|---|---|---|---|---|---|---|---|---|---|---|---|---|---|---|---|---|---|---|---|---|---|---|---|---|---|---|---|---|---|---|---|---|---|---|---|---|---|---|---|---|---|---|---|---|---|---|---|---|---|---|---|---|---|---|---|---|---|---|---|---|---|---|---|---|---|---|---|---|---|---|---|---|---|---|---|---|---|---|---|---|---|---|---|---|---|---|---|---|---|---|---|---|---|---|---|---|---|---|---|---|---|---|---|---|---|---|---|---|---|---|---|---|---|---|---|---|---|---|---|---|---|---|---|---|---|---|---|---|---|---|---|---|---|---|---|---|---|---|---|---|---|---|---|---|---|---|---|---|---|---|---|---|---|---|---|---|---|---|---|---|---|---|---|---|---|---|---|---|---|---|---|---|---|---|---|---|---|---|---|---|---|---|---|---|---|---|---|---|---|---|---|---|---|---|---|---|---|---|---|---|---|---|---|---|---|---|---|---|---|---|---|---|---|---|---|---|---|---|---|---|---|---|---|---|---|---|---|---|---|---|---|---|---|---|---|---|---|---|---|---|---|---|---|---|---|---|---|---|---|---|---|---|---|---|---|---|---|---|---|---|---|---|---|---|---|---|---|---|---|---|---|---|---|---|---|---|---|---|---|---|---|---|---|---|---|---|---|---|---|---|---|---|---|---|---|---|---|---|---|---|---|---|---|---|---|---|---|---|---|---|---|---|---|---|---|---|---|---|---|---|---|---|---|---|---|---|---|---|---|---|---|---|---|---|---|---|---|---|---|---|---|---|---|---|---|---|---|---|---|---|---|---|---|---|---|---|---|---|---|---|---|---|---|---|---|---|---|---|---|---|---|---|---|---|---|---|---|---|---|---|---|---|---|---|---|---|---|---|---|---|---|---|---|---|---|---|---|---|---|---|---|---|---|---|---|---|---|---|---|---|---|---|---|---|---|---|---|---|---|---|---|---|---|---|---|---|---|---|---|---|---|---|---|---|---|---|---|---|---|---|---|---|---|---|---|---|---|---|---|---|---|---|---|---|---|---|---|---|---|---|---|---|---|---|---|---|---|---|---|---|---|---|---|---|---|---|---|---|---|---|---|---|---|---|---|---|---|---|---|---|---|---|---|---|---|---|---|---|---|---|---|---|---|---|---|---|---|---|---|---|---|---|---|---|---|---|---|---|---|---|---|---|---|---|---|---|---|---|---|---|---|---|---|---|---|---|---|---|---|---|---|---|---|---|---|---|---|---|---|---|---|---|---|---|---|---|---|---|---|---|---|---|---|---|---|---|---|---|---|---|---|---|---|---|---|---|---|---|---|---|---|---|---|---|---|---|---|---|---|---|---|---|---|---|---|---|---|---|---|---|---|---|---|---|---|---|---|---|---|---|---|---|---|---|---|---|---|---|---|---|---|---|---|---|---|---|---|---|---|---|---|---|---|---|---|---|---|---|---|---|---|---|---|---|---|---|---|---|---|---|---|---|---|---|---|---|---|---|---|---|---|---|---|---|---|---|---|---|---|---|---|---|---|---|---|---|---|---|---|---|---|---|---|---|---|---|---|---|---|---|---|---|---|---|---|---|---|---|---|---|---|---|---|---|---|---|---|---|---|---|---|---|---|---|---|---|---|---|---|---|---|---|---|---|---|---|---|---|---|---|---|---|---|---|---|---|---|---|---|---|---|---|---|---|
| Share Class | YTD* | 1 Yr | 3 Yr | 5 Yr | 10 Yr | Since Incep | |||||||||||||||||||||||||||||||||||||||||||||||||||||||||||||||||||||||||||||||||||||||||||||||||||||||||||||||||||||||||||||||||||||||||||||||||||||||||||||||||||||||||||||||||||||||||||||||||||||||||||||||||||||||||||||||||||||||||||||||||||||||||||||||||||||||||||||||||||||||||||||||||||||||||||||||||||||||||||||||||||||||||||||||||||||||||||||||||||||||||||||||||||||||||||||||||||||||||||||||||||||||||||||||||||||||||||||||||||||||||||||||||||||||||||||||||||||||||||||||||||||||||||||||||||||||||||||||||||||||||||||||||||||||||||||||||||||||||||||||||||||||||||||||||||||||||||||||||||||||||||||||||||||||||||||||||||||||||||||||||||||||||||||||||||||||||||||||||||||||||||||||||||||||||||||||||||||||||||||||||||||||||||||||||||||||||||||||||||||||||||||||||||||||||||||||||||||||||||||||||||||||||||||||||||||||||||||||||||||||||||||||||||||||||||||||||||||||||||||||||||||||||||||||||||||||||||||||||||||||||||||||||||||||||||||||||||||||||||||||||||||||||||||||||||||||||||||||||
|
|
D Shares | 13.18% | 41.42% | 7.38% | 12.98% | 10.39% | 8.69% | ||||||||||||||||||||||||||||||||||||||||||||||||||||||||||||||||||||||||||||||||||||||||||||||||||||||||||||||||||||||||||||||||||||||||||||||||||||||||||||||||||||||||||||||||||||||||||||||||||||||||||||||||||||||||||||||||||||||||||||||||||||||||||||||||||||||||||||||||||||||||||||||||||||||||||||||||||||||||||||||||||||||||||||||||||||||||||||||||||||||||||||||||||||||||||||||||||||||||||||||||||||||||||||||||||||||||||||||||||||||||||||||||||||||||||||||||||||||||||||||||||||||||||||||||||||||||||||||||||||||||||||||||||||||||||||||||||||||||||||||||||||||||||||||||||||||||||||||||||||||||||||||||||||||||||||||||||||||||||||||||||||||||||||||||||||||||||||||||||||||||||||||||||||||||||||||||||||||||||||||||||||||||||||||||||||||||||||||||||||||||||||||||||||||||||||||||||||||||||||||||||||||||||||||||||||||||||||||||||||||||||||||||||||||||||||||||||||||||||||||||||||||||||||||||||||||||||||||||||||||||||||||||||||||||||||||||||||||||||||||||||||||||||||||||||||||||||||||||
The average annual total returns for Selected American Shares’s Class S shares for periods ending March 31, 2024 are: 1 year, 40.96%; 5 years, 12.62%; and 10 years, 10.04%. The performance presented represents past performance and is not a guarantee of future results. Total return assumes reinvestment of dividends and capital gain distributions. Investment return and principal value will vary so that, when redeemed, an investor’s shares may be worth more or less than their original cost. For most recent month-end performance, visit selectedfunds.com or call 800-243-1575. Current performance may be lower or higher than the performance quoted. The total annual operating expense ratio for Class S Shares as of the most recent prospectus was 0.99%. The total annual operating expense ratio may vary in future years. The total annual operating expense ratio may vary in future years. Returns and expenses for other classes of shares will vary.
D Shares: Monthly (as of 3/31/24)
|
|
|||||||||||||||||||||||||||||||||||||||||||||||||||||||||||||||||||||||||||||||||||||||||||||||||||||||||||||||||||||||||||||||||||||||||||||||||||||||||||||||||||||||||||||||||||||||||||||||||||||||||||||||||||||||||||||||||||||||||||||||||||||||||||||||||||||||||||||||||||||||||||||||||||||||||||||||||||||||||||||||||||||||||||||||||||||||||||||||||||||||||||||||||||||||||||||||||||||||||||||||||||||||||||||||||||||||||||||||||||||||||||||||||||||||||||||||||||||||||||||||||||||||||||||||||||||||||||||||||||||||||||||||||||||||||||||||||||||||||||||||||||||||||||||||||||||||||||||||||||||||||||||||||||||||||||||||||||||||||||||||||||||||||||||||||||||||||||||||||||||||||||||||||||||||||||||||||||||||||||||||||||||||||||||||||||||||||||||||||||||||||||||||||||||||||||||||||||||||||||||||||||||||||||||||||||||||||||||||||||||||||||||||||||||||||||||||||||||||||||||||||||||||||||||||||||||||||||||||||||||||||||||||||||||||||||||||||||||||||||||||||||||||||||||||||||||||||||||||||||||||
|---|---|---|---|---|---|---|---|---|---|---|---|---|---|---|---|---|---|---|---|---|---|---|---|---|---|---|---|---|---|---|---|---|---|---|---|---|---|---|---|---|---|---|---|---|---|---|---|---|---|---|---|---|---|---|---|---|---|---|---|---|---|---|---|---|---|---|---|---|---|---|---|---|---|---|---|---|---|---|---|---|---|---|---|---|---|---|---|---|---|---|---|---|---|---|---|---|---|---|---|---|---|---|---|---|---|---|---|---|---|---|---|---|---|---|---|---|---|---|---|---|---|---|---|---|---|---|---|---|---|---|---|---|---|---|---|---|---|---|---|---|---|---|---|---|---|---|---|---|---|---|---|---|---|---|---|---|---|---|---|---|---|---|---|---|---|---|---|---|---|---|---|---|---|---|---|---|---|---|---|---|---|---|---|---|---|---|---|---|---|---|---|---|---|---|---|---|---|---|---|---|---|---|---|---|---|---|---|---|---|---|---|---|---|---|---|---|---|---|---|---|---|---|---|---|---|---|---|---|---|---|---|---|---|---|---|---|---|---|---|---|---|---|---|---|---|---|---|---|---|---|---|---|---|---|---|---|---|---|---|---|---|---|---|---|---|---|---|---|---|---|---|---|---|---|---|---|---|---|---|---|---|---|---|---|---|---|---|---|---|---|---|---|---|---|---|---|---|---|---|---|---|---|---|---|---|---|---|---|---|---|---|---|---|---|---|---|---|---|---|---|---|---|---|---|---|---|---|---|---|---|---|---|---|---|---|---|---|---|---|---|---|---|---|---|---|---|---|---|---|---|---|---|---|---|---|---|---|---|---|---|---|---|---|---|---|---|---|---|---|---|---|---|---|---|---|---|---|---|---|---|---|---|---|---|---|---|---|---|---|---|---|---|---|---|---|---|---|---|---|---|---|---|---|---|---|---|---|---|---|---|---|---|---|---|---|---|---|---|---|---|---|---|---|---|---|---|---|---|---|---|---|---|---|---|---|---|---|---|---|---|---|---|---|---|---|---|---|---|---|---|---|---|---|---|---|---|---|---|---|---|---|---|---|---|---|---|---|---|---|---|---|---|---|---|---|---|---|---|---|---|---|---|---|---|---|---|---|---|---|---|---|---|---|---|---|---|---|---|---|---|---|---|---|---|---|---|---|---|---|---|---|---|---|---|---|---|---|---|---|---|---|---|---|---|---|---|---|---|---|---|---|---|---|---|---|---|---|---|---|---|---|---|---|---|---|---|---|---|---|---|---|---|---|---|---|---|---|---|---|---|---|---|---|---|---|---|---|---|---|---|---|---|---|---|---|---|---|---|---|---|---|---|---|---|---|---|---|---|---|---|---|---|---|---|---|---|---|---|---|---|---|---|---|---|---|---|---|---|---|---|---|---|---|---|---|---|---|---|---|---|---|---|---|---|---|---|---|---|---|---|---|---|---|---|---|---|---|---|---|---|---|---|---|---|---|---|---|---|---|---|---|---|---|---|---|---|---|---|---|---|---|---|---|---|---|---|---|---|---|---|---|---|---|---|---|---|---|---|---|---|---|---|---|---|---|---|---|---|---|---|---|---|---|---|---|---|---|---|---|---|---|---|---|---|---|---|---|---|---|---|---|---|---|---|---|---|---|---|---|---|---|---|---|---|---|---|---|---|---|---|---|---|---|---|---|---|---|---|---|---|---|---|---|---|---|---|---|---|---|---|---|---|---|---|---|---|---|---|---|---|---|---|---|---|---|---|---|---|---|---|---|---|---|---|---|---|---|---|---|---|---|---|---|---|---|---|---|---|---|---|---|---|---|---|---|---|---|---|---|---|---|---|---|---|---|---|---|---|---|---|---|---|---|---|---|---|---|---|---|---|---|---|---|---|---|---|---|---|---|---|---|---|---|---|---|---|---|---|---|---|---|---|---|---|---|---|---|---|---|---|---|---|---|---|---|---|---|---|---|---|---|---|---|---|---|---|---|---|---|---|---|---|---|---|---|---|---|---|---|---|---|---|---|---|---|---|---|---|---|---|---|---|---|---|---|---|---|---|---|---|---|---|---|---|---|---|---|---|---|---|---|---|---|---|---|---|---|---|---|---|---|---|---|---|---|---|---|---|---|---|---|---|---|---|---|---|---|---|---|---|---|---|---|---|---|---|---|---|---|---|---|---|---|---|---|---|---|---|---|---|---|---|---|---|---|---|---|---|---|---|---|---|---|---|---|---|---|---|---|---|---|---|---|---|---|---|---|---|---|---|---|---|---|---|---|---|---|---|---|
| Share Class | YTD* | 1 Yr | 3 Yr | 5 Yr | 10 Yr | Since Incep | |||||||||||||||||||||||||||||||||||||||||||||||||||||||||||||||||||||||||||||||||||||||||||||||||||||||||||||||||||||||||||||||||||||||||||||||||||||||||||||||||||||||||||||||||||||||||||||||||||||||||||||||||||||||||||||||||||||||||||||||||||||||||||||||||||||||||||||||||||||||||||||||||||||||||||||||||||||||||||||||||||||||||||||||||||||||||||||||||||||||||||||||||||||||||||||||||||||||||||||||||||||||||||||||||||||||||||||||||||||||||||||||||||||||||||||||||||||||||||||||||||||||||||||||||||||||||||||||||||||||||||||||||||||||||||||||||||||||||||||||||||||||||||||||||||||||||||||||||||||||||||||||||||||||||||||||||||||||||||||||||||||||||||||||||||||||||||||||||||||||||||||||||||||||||||||||||||||||||||||||||||||||||||||||||||||||||||||||||||||||||||||||||||||||||||||||||||||||||||||||||||||||||||||||||||||||||||||||||||||||||||||||||||||||||||||||||||||||||||||||||||||||||||||||||||||||||||||||||||||||||||||||||||||||||||||||||||||||||||||||||||||||||||||||||||||||||||||||||
|
|
D Shares | 13.18% | 41.42% | 7.38% | 12.98% | 10.39% | 8.69% | ||||||||||||||||||||||||||||||||||||||||||||||||||||||||||||||||||||||||||||||||||||||||||||||||||||||||||||||||||||||||||||||||||||||||||||||||||||||||||||||||||||||||||||||||||||||||||||||||||||||||||||||||||||||||||||||||||||||||||||||||||||||||||||||||||||||||||||||||||||||||||||||||||||||||||||||||||||||||||||||||||||||||||||||||||||||||||||||||||||||||||||||||||||||||||||||||||||||||||||||||||||||||||||||||||||||||||||||||||||||||||||||||||||||||||||||||||||||||||||||||||||||||||||||||||||||||||||||||||||||||||||||||||||||||||||||||||||||||||||||||||||||||||||||||||||||||||||||||||||||||||||||||||||||||||||||||||||||||||||||||||||||||||||||||||||||||||||||||||||||||||||||||||||||||||||||||||||||||||||||||||||||||||||||||||||||||||||||||||||||||||||||||||||||||||||||||||||||||||||||||||||||||||||||||||||||||||||||||||||||||||||||||||||||||||||||||||||||||||||||||||||||||||||||||||||||||||||||||||||||||||||||||||||||||||||||||||||||||||||||||||||||||||||||||||||||||||||||||
The average annual total returns for Selected American Shares’s Class S shares for periods ending March 31, 2024 are: 1 year, 40.96%; 5 years, 12.62%; and 10 years, 10.04%. The performance presented represents past performance and is not a guarantee of future results. Total return assumes reinvestment of dividends and capital gain distributions. Investment return and principal value will vary so that, when redeemed, an investor’s shares may be worth more or less than their original cost. For most recent month-end performance, visit selectedfunds.com or call 800-243-1575. Current performance may be lower or higher than the performance quoted. The total annual operating expense ratio for Class S Shares as of the most recent prospectus was 0.99%. The total annual operating expense ratio may vary in future years. The total annual operating expense ratio may vary in future years. Returns and expenses for other classes of shares will vary.
Portfolio Characteristics as of 3/31/24
Portfolio Composition
| Item | Selected American Shares | S&P 500 Index® |
|---|---|---|
| P/E (Forward) Forward Price/Earnings (Forward P/E) Ratio is a stock’s price at the date indicated divided by the company’s forecasted earnings for the following 12 months based on estimates provided by the Fund’s data provider. These values for both the Fund and the Index are the weighted average of the stocks in the portfolio or index. | 14.3x | 21.9x |
| 5 Year Earnings Growth | 15.4% | 14.8% |
| P/B Ratio Price/Book (P/B) Ratio is the weighted average of the P/B ratios of the stocks in a portfolio. The P/B ratio of a stock is calculated by dividing the current price of the stock by the company’s per share book value. Stocks with negative book values are excluded for this calculation. | 3.1 | 4.7 |
| Active Share Active Share is a measure of the percentage of stock holdings in a manager's portfolio that differ from the benchmark index. | 84% | N/A |
| Standard Deviation (5 year, S Shares) Standard Deviation is a measure of the average deviations of a return series from its mean; often used as a risk measure. A large standard deviation implies that there have been large swings or volatility in the manager’s return series. | 21.3 | 18.4 |
| Number of Holdings | 39 | 504 |
| Weighted Average Market Cap ($bn) Weighted Average Market Capitalization is the portfolio-weighted mean capitalizations of all equity securities. | 385.0 | 755.4 |
| Median Market Cap ($bn) Median Market Capitalization is the midpoint of market capitalization of the stocks in a portfolio. | 43.5 | 34.8 |
| Selected American Shares | Large Cap Value Category Average | |
|---|---|---|
| Turnover Rate Turnover Rate is a measure of the trading activity in a mutual fund’s investment portfolio that reflects how often securities are bought and sold. These amounts are as of the most recent prospectus. Over the last five years, the high and low turnover rate was 20% and 8%, respectively. | 9% | 41% |

Mastering the Mental Game of Investing
A video series to help you develop the mindset of a successful investor.
Watch the SeriesPortfolio Holdings The information provided should not be considered a recommendation to buy, sell or hold any particular security. Davis Funds has adopted a Portfolio Holdings Disclosure policy that governs the release of non-public portfolio holding information. This policy is described in the prospectus. Holding percentages are subject to change.
Top 10 Holdings: Quarterly (as of 3/31/24)
| Holding | Ticker | Selected American Shares | S&P 500 Index® |
|---|---|---|---|
| Meta Platforms | META | 9.0% | 2.4% |
| Berkshire Hathaway | BRK A | 8.3% | 1.7% |
| Capital One Financial | COF | 6.8% | 0.1% |
| Applied Materials | AMAT | 6.7% | 0.4% |
| Wells Fargo | WFC | 6.6% | 0.5% |
| Amazon.com | AMZN | 5.4% | 3.7% |
| Viatris | VTRS | 3.9% | < 0.1% |
| JPMorgan Chase | JPM | 3.8% | 1.3% |
| Humana | HUM | 3.6% | 0.1% |
| Alphabet | GOOGL | 3.2% | 3.7% |
| Top 10 Holdings Total % of Portfolio | 57.3% | 14.1% | |
Top 10 Holdings: Monthly (as of 3/31/24)
| Holding | Ticker | Selected American Shares | S&P 500 Index® |
|---|---|---|---|
| Meta Platforms | META | 9.0% | 2.4% |
| Berkshire Hathaway | BRK A | 8.3% | 1.7% |
| Capital One Financial | COF | 6.8% | 0.1% |
| Applied Materials | AMAT | 6.7% | 0.4% |
| Wells Fargo | WFC | 6.6% | 0.5% |
| Amazon.com | AMZN | 5.4% | 3.7% |
| Viatris | VTRS | 3.9% | < 0.1% |
| JPMorgan Chase | JPM | 3.8% | 1.3% |
| Humana | HUM | 3.6% | 0.1% |
| Alphabet | GOOGL | 3.2% | 3.7% |
| Top 10 Holdings Total % of Portfolio | 57.3% | 14.1% | |
All Holdings: Quarterly (as of 3/31/24)
| Holding | Ticker | Selected American Shares | S&P 500 Index® |
|---|---|---|---|
| Meta Platforms | META | 9.0% | 2.4% |
| Berkshire Hathaway | BRK A | 8.3% | — |
| Capital One Financial | COF | 6.8% | 0.1% |
| Applied Materials | AMAT | 6.7% | 0.4% |
| Wells Fargo | WFC | 6.6% | 0.5% |
| Amazon.com | AMZN | 5.4% | 3.7% |
| Viatris | VTRS | 3.9% | < 0.1% |
| JPMorgan Chase | JPM | 3.8% | 1.3% |
| Humana | HUM | 3.6% | 0.1% |
| Alphabet | GOOGL | 3.2% | 2.0% |
| Bank of New York Mellon | BK | 3.2% | 0.1% |
| MGM Resorts | MGM | 3.0% | < 0.1% |
| Texas Instruments | TXN | 2.9% | 0.4% |
| Cigna Group | CI | 2.8% | 0.2% |
| U.S. Bancorp | USB | 2.8% | 0.2% |
| Danske Bank | DANSKE DC | 2.7% | — |
| DBS Group Holdings | DBS SP | 2.5% | — |
| Teck Resources | TECK | 2.4% | — |
| Owens Corning | OC | 2.1% | — |
| Samsung Electronics | 005930 KS | 1.9% | — |
| Chubb | CB | 1.7% | 0.2% |
| Intel | INTC | 1.6% | 0.4% |
| Markel Group | MKL | 1.5% | — |
| Microsoft | MSFT | 1.3% | 7.1% |
| Quest Diagnostics | DGX | 1.3% | < 0.1% |
| Prosus | PRX NA | 1.1% | — |
| DiDi Global | DIDIY | 1.0% | — |
| AIA Group | 1299 HK | 0.9% | — |
| AGCO | AGCO | 0.8% | — |
| IAC | IAC | 0.8% | — |
| Ping An Insurance Group | 2318 HK | 0.8% | — |
| American Express | AXP | 0.7% | 0.3% |
| Coupang | CPNG | 0.7% | — |
| Darling Ingredients | DAR | 0.6% | — |
| JD.com | JD | 0.5% | — |
| Naspers | NPN SJ | 0.2% | — |
| Orascom Construction | OC DU | 0.1% | — |
| ASAC II | ASAC LP | 0.1% | — |
| Cash | — | 0.9% | — |
All Holdings: Monthly (as of 3/31/24)
| Holding | Ticker | Selected American Shares | S&P 500 Index® |
|---|---|---|---|
| Meta Platforms | META | 9.0% | 2.4% |
| Berkshire Hathaway | BRK A | 8.3% | — |
| Capital One Financial | COF | 6.8% | 0.1% |
| Applied Materials | AMAT | 6.7% | 0.4% |
| Wells Fargo | WFC | 6.6% | 0.5% |
| Amazon.com | AMZN | 5.4% | 3.7% |
| Viatris | VTRS | 3.9% | < 0.1% |
| JPMorgan Chase | JPM | 3.8% | 1.3% |
| Humana | HUM | 3.6% | 0.1% |
| Alphabet | GOOGL | 3.2% | 2.0% |
| Bank of New York Mellon | BK | 3.2% | 0.1% |
| MGM Resorts | MGM | 3.0% | < 0.1% |
| Texas Instruments | TXN | 2.9% | 0.4% |
| Cigna Group | CI | 2.8% | 0.2% |
| U.S. Bancorp | USB | 2.8% | 0.2% |
| Danske Bank | DANSKE DC | 2.7% | — |
| DBS Group Holdings | DBS SP | 2.5% | — |
| Teck Resources | TECK | 2.4% | — |
| Owens Corning | OC | 2.1% | — |
| Samsung Electronics | 005930 KS | 1.9% | — |
| Chubb | CB | 1.7% | 0.2% |
| Intel | INTC | 1.6% | 0.4% |
| Markel Group | MKL | 1.5% | — |
| Microsoft | MSFT | 1.3% | 7.1% |
| Quest Diagnostics | DGX | 1.3% | < 0.1% |
| Prosus | PRX NA | 1.1% | — |
| DiDi Global | DIDIY | 1.0% | — |
| AIA Group | 1299 HK | 0.9% | — |
| AGCO | AGCO | 0.8% | — |
| IAC | IAC | 0.8% | — |
| Ping An Insurance Group | 2318 HK | 0.8% | — |
| American Express | AXP | 0.7% | 0.3% |
| Coupang | CPNG | 0.7% | — |
| Darling Ingredients | DAR | 0.6% | — |
| JD.com | JD | 0.5% | — |
| Naspers | NPN SJ | 0.2% | — |
| Orascom Construction | OC DU | 0.1% | — |
| ASAC II | ASAC LP | 0.1% | — |
| Cash | — | 0.9% | — |

"We are highly selective. Few companies satisfy the characteristics of durability, competitive moats, growth and attractive prices we demand.
The result: Our portfolios look very different from the index."
Sector Allocation The Global Industry Classification Standard (GICS®) is the exclusive intellectual property of MSCI Inc. (MSCI) and S&P Global (“S&P”). Neither MSCI, S&P, their affiliates, nor any of their third party providers (“GICS Parties”) makes any representations or warranties, express or implied, with respect to GICS or the results to be obtained by the use thereof, and expressly disclaim all warranties, including warranties of accuracy, completeness, merchantability and fitness for a particular purpose. The GICS Parties shall not have any liability for any direct, indirect, special, punitive, consequential or any other damages (including lost profits) even if notified of such damages.
| Sector | Selected American Shares | S&P 500 Index® |
|---|---|---|
| Financials | 42.5% | 13.2% |
| Information Technology | 14.6% | 29.5% |
| Communication Services | 13.3% | 9.0% |
| Health Care | 11.7% | 12.4% |
| Consumer Discretionary | 10.9% | 10.3% |
| Industrials | 4.1% | 8.8% |
| Materials | 2.4% | 2.4% |
| Consumer Staples | 0.6% | 6.0% |
| Energy | — | 4.0% |
| Real Estate | — | 2.3% |
| Utilities | — | 2.2% |
Market Cap Breakout The Adviser considers companies with market capitalizations over $10 billion to be large-capitalization companies, between $3 billion and $10 billion to be mid-capitalization companies, and under $3 billion to be small-capitalization companies.
| Selected American Shares | ||
|---|---|---|
| Market | Percentage | |
|
|
Large | 97.6% |
|
|
Mid | 2.3% |
|
|
Small | 0.1% |
| S&P 500 Index® Index | ||
|---|---|---|
| Market | Percentage | |
|
|
Large | 99.6% |
|
|
Mid | 0.4% |
|
|
Small | 0.0% |
PM Commentary
Portfolio Manager Commentaries
| Document | Description |
|---|---|
| Manager Commentary - Annual Review 2024 | An interview with the Fund Managers. |
Factsheet
Fact Sheets
| Document | Description | Date |
|---|---|---|
| Fund Fact Sheet | Goals of the Fund, types of companies in the Portfolio, top holdings, Portfolio characteristics, and historical performance. | March 2024 |
Video
Video Insights

How Selected American Shares is Benefiting in this Transitioning Market
The end of the easy-money era, why fundamentals matter again and drivers of recent performance

The Return to Rationality
The bursting of the easy money bubble marks a huge transition for the markets
Investor Implications of Rising Rates
How the end of the free money era is ending the distortions of the past decade and returning rationality to the markets
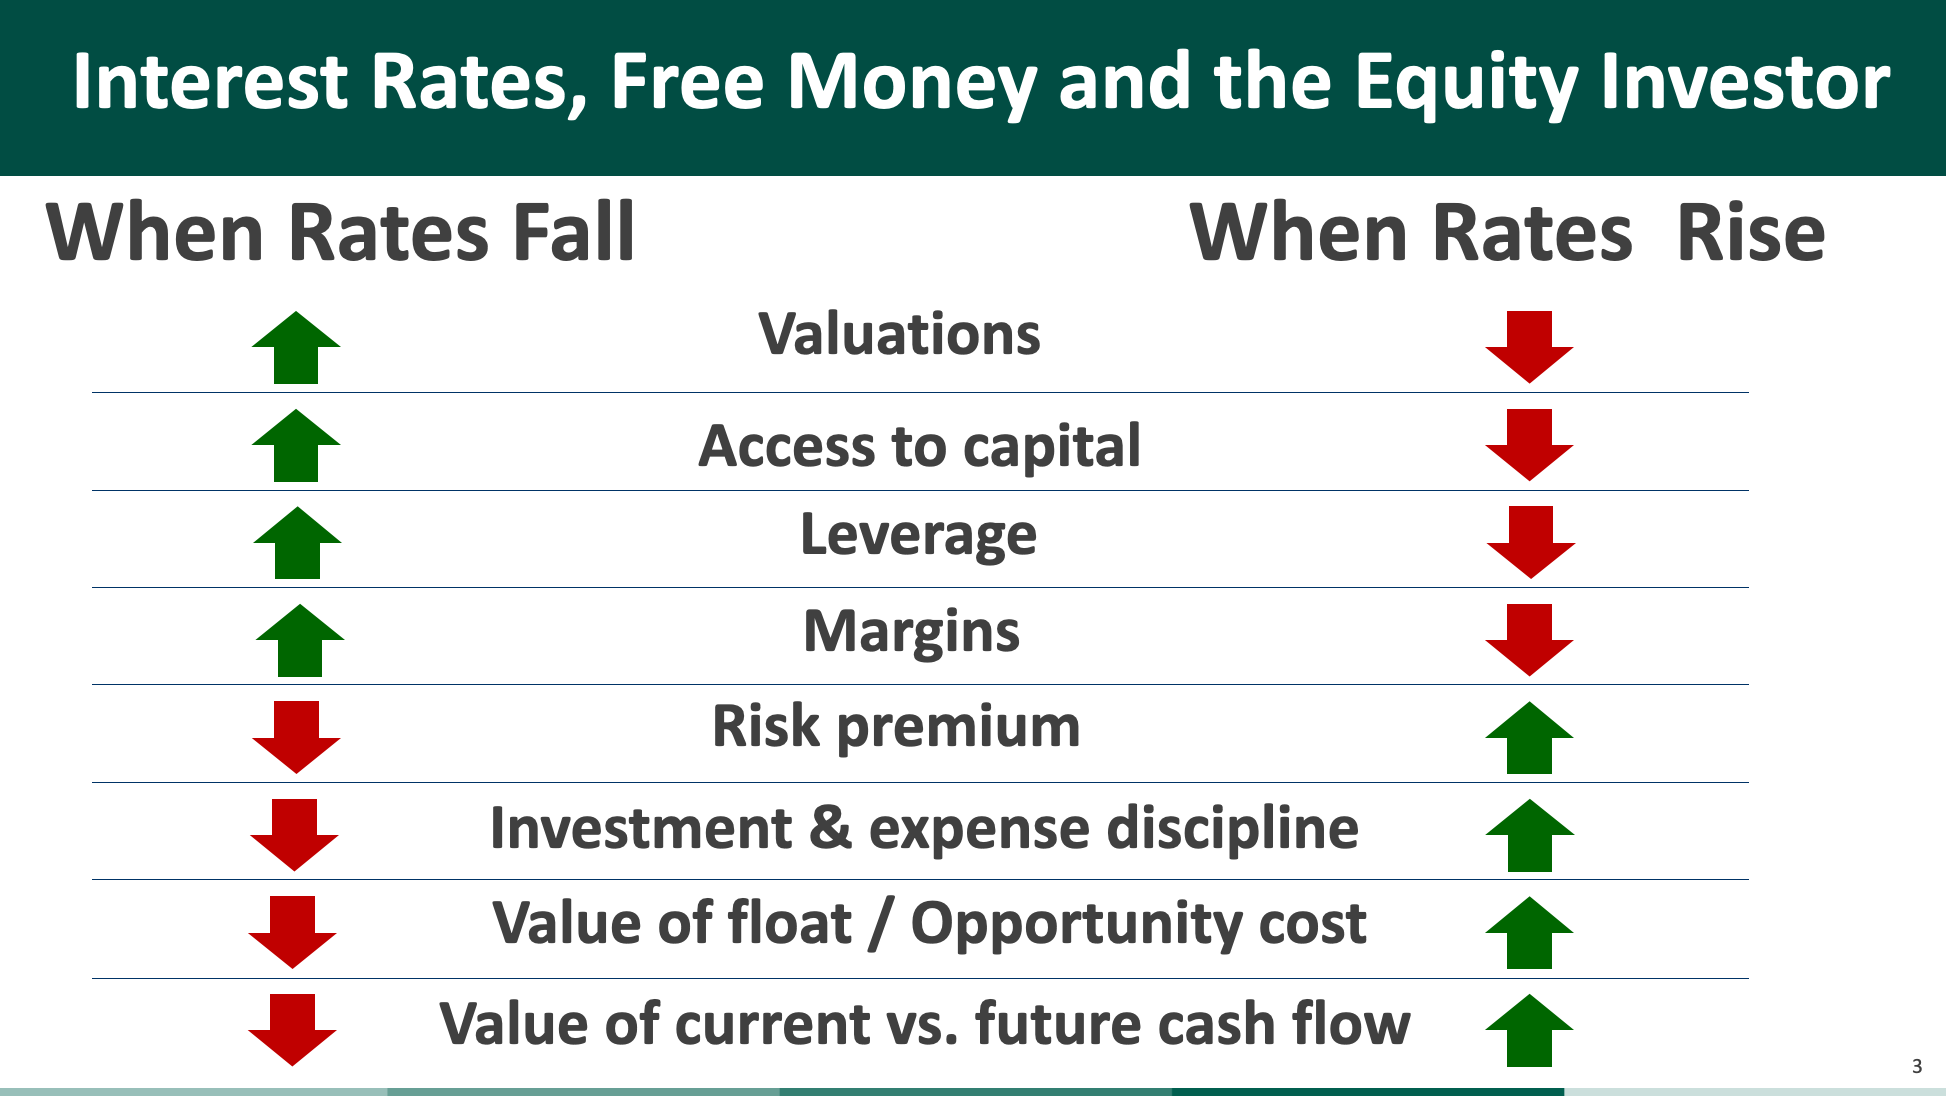
What to Own and Avoid in Today’s Market
In our view, what types of companies should be avoided, and which stand to benefit from the end of the easy money era
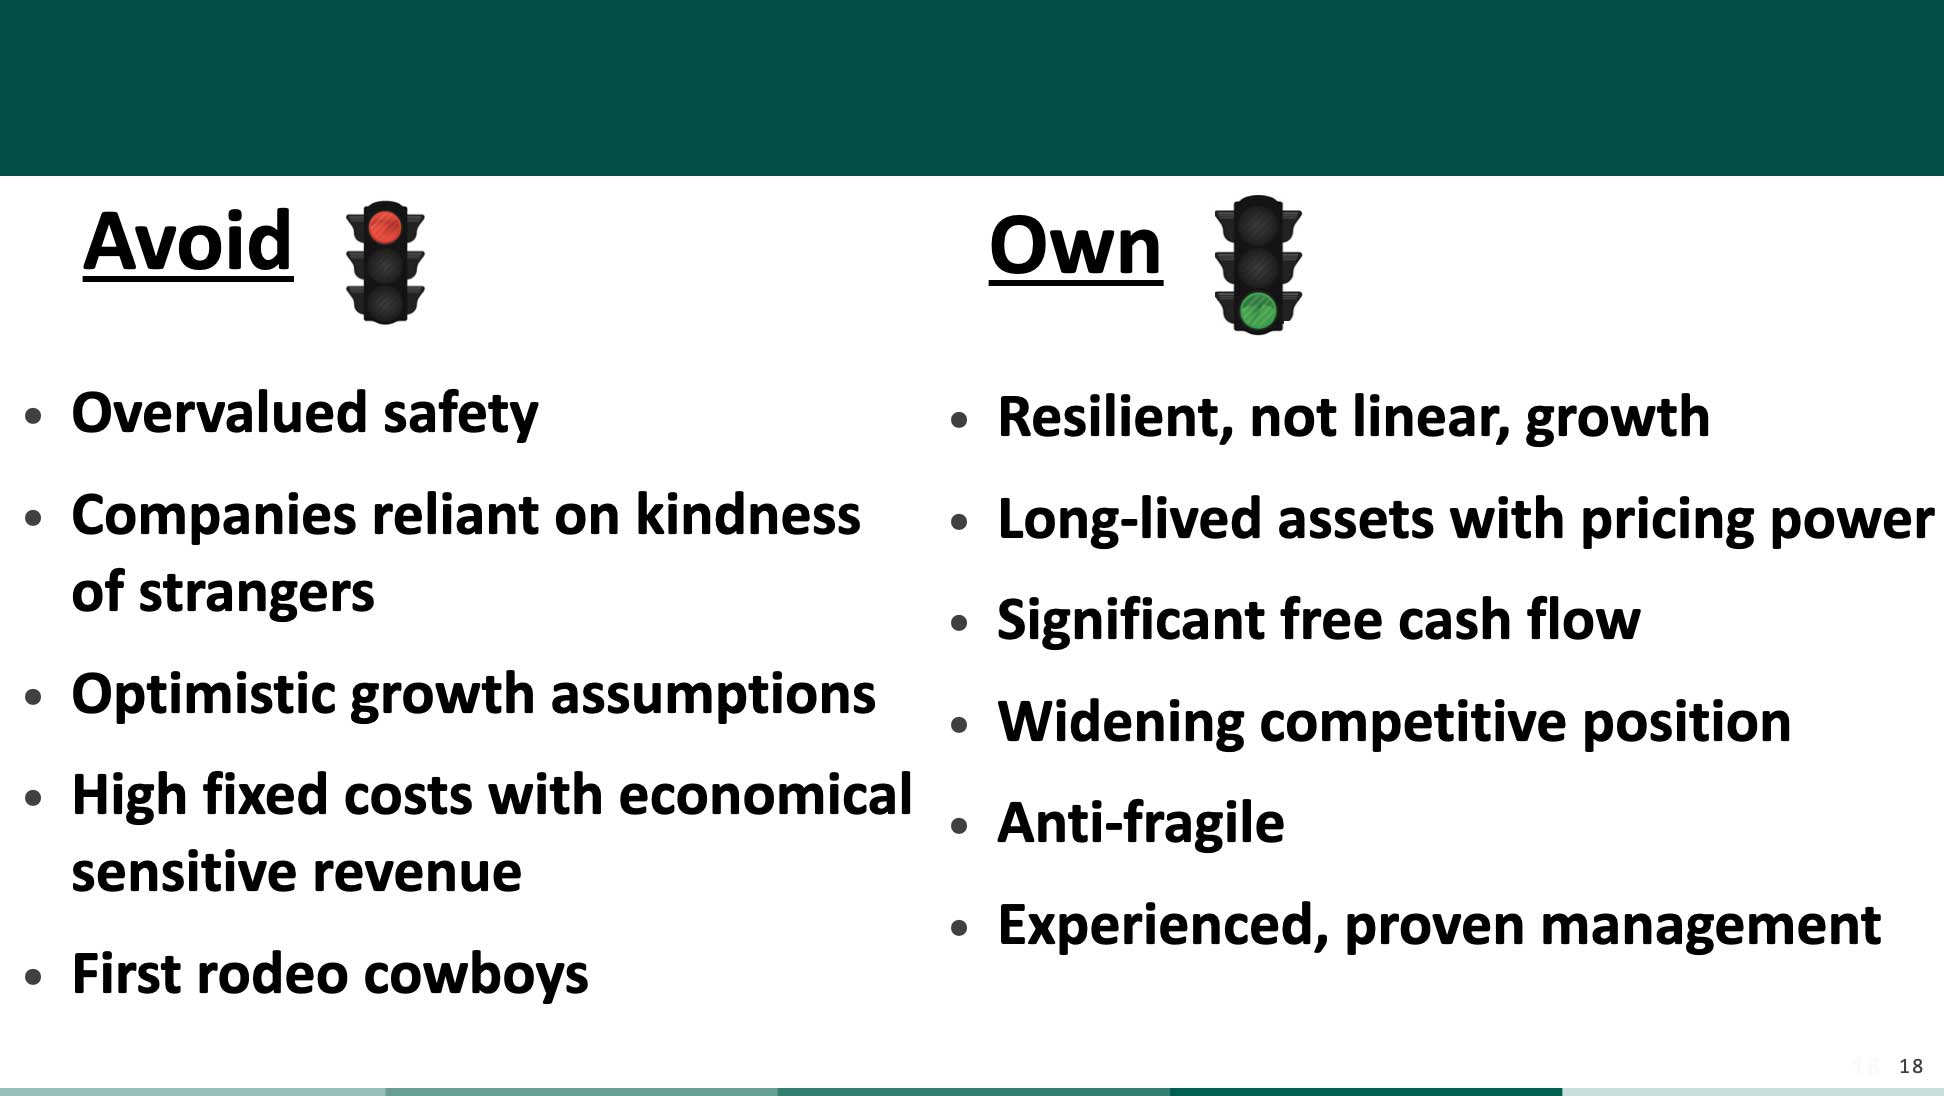
Investment Themes We’re Focusing on Today
Tech, Semis, Financials and other themes we expect to drive returns
Insights
Fund Insights
| Document | Description |
|---|---|
| Selected American Shares: Selective. Attractive Growth. Undervalued. | Our companies are rigorously researched, offer attractive growth and yet are significantly undervalued versus the benchmark - A powerful combination. |
Literature
Regulatory Reports
| Document |
|---|
| Summary Prospectus |
| Statutory Prospectus |
| Statement of Additional Information |
| Annual Report |
| Semi-Annual Report |
| N-Port 1Q |
| N-Port 3Q |
Purchase Details
Open an Account
You can invest with Selected Funds in a number of ways:
- Speak with your Financial Advisor
- Open an account by mail by downloading the applications below
| Document |
|---|
| Application for Individuals (Joint, Trust, Custodial) |
| Application for Businesses |
|
Application for Individual Retirement Account (IRA)
Please download one of the following disclosure and custodial agreements: |
|
Application for Coverdell Education Savings Account
Please download the Coverdell Education Savings Account Disclosure and Custodial Agreement |
Account Minimums
| Investment | Class S | Class D |
|---|---|---|
| Minimum Initial Investment | $1,000 | $10,000 |
| Minimum Additional Investment | $25 | $25 |
Distributions
2023 Distributions as of 01/08/24
This information on 2023 distributions is intended for existing shareholders
As large shareholders ourselves, we are conscious of tax costs and make every effort to be tax efficient.
Capital gains result from appreciation in the portfolio. The funds' long-term investment approach means that this appreciation may have occurred over an extended period of time. The majority of the gains are long-term and generally subject to lower tax rates than short-term gains or dividend income.
| Share Class | Record Date | Ex-Date | Payable Date | Qualified Dividend Percentage | Ordinary Income | Return of Capital | Short-term Capital Gain | Long-term Capital Gain | Reinvestment Price |
|---|---|---|---|---|---|---|---|---|---|
| Class S | 6/26/23 | 6/27/23 | 6/28/23 | 63.62% | 0.1458 | - | - | 1.00 | 35.52 |
| 12/7/23 | 12/8/23 | 12/11/23 | 63.62% | 0.1836 | - | 0.46 | 1.16 | 35.95 | |
| Class D | 6/26/23 | 6/27/23 | 6/28/23 | 63.62% | 0.201 | - | - | 1.00 | 35.62 |
| 12/7/23 | 12/8/23 | 12/11/23 | 63.62% | 0.2425 | - | 0.46 | 1.16 | 36.05 |
Shareholders should not use this information for tax reporting purposes. Form 1099 will be sent at a later date for all tax reporting.
The table above includes the percentage of 2023 dividend and net short-term capital gain distributions, by fund, that are eligible for reduced tax rates as "qualified dividend income" (QDI). QDI-eligible amounts, including any net short-term capital gains, are reported to shareholders in Box 1b of Form 1099-DIV. For those shareholders who do not receive a Form 1099-DIV, QDI-eligible amounts can be determined by applying the relevant percentages from the table to the dividend and net short-term capital gain distributions shown on the shareholder's 2023 year-end account statement. Individual questions should be referred to your tax advisor.
Carefully consider the fund's investment objectives, strategies, risks, charges and expenses before investing or sending money. The prospectus contains this and other information and can be obtained by clicking here.
Before investing in the Selected Funds, you should carefully consider the investment objectives, risks, charges, and expenses of the Funds. The prospectus and summary prospectus contains this and other information about the Funds. You can obtain performance information and a current prospectus and summary prospectus by visiting selectedfunds.com or calling 800.243.1575. Please read the prospectus or summary prospectus carefully before investing or sending money. Investing involves risks including possible loss of principal.